Income Statement Tab
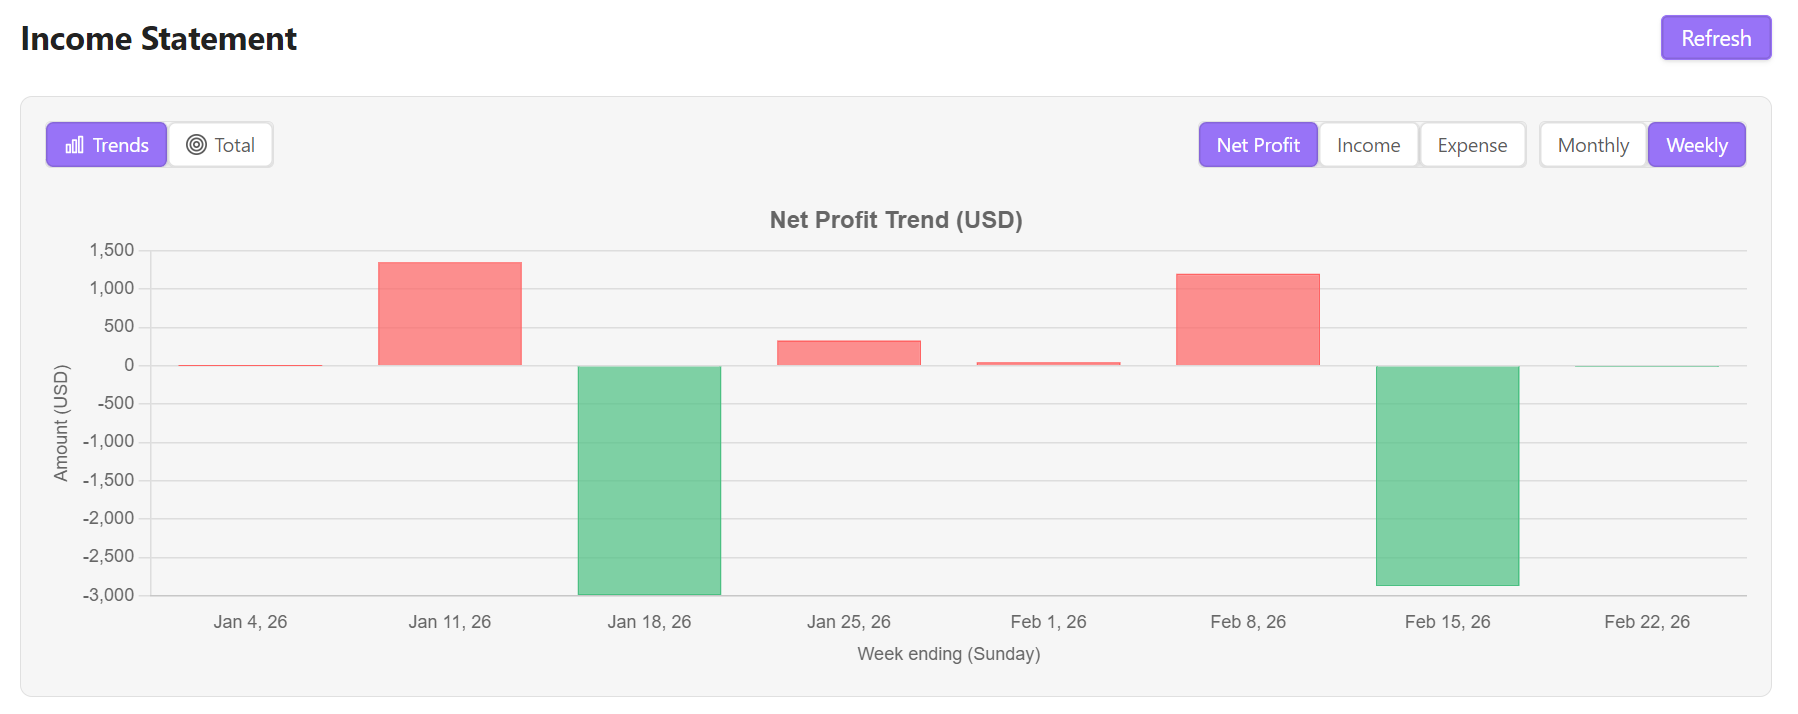
The Income Statement Tab (also known as a Profit and Loss statement) summarizes your revenues and expenses over the lifetime of your ledger, showing your net profit or loss.
📈 Income vs. Expenses
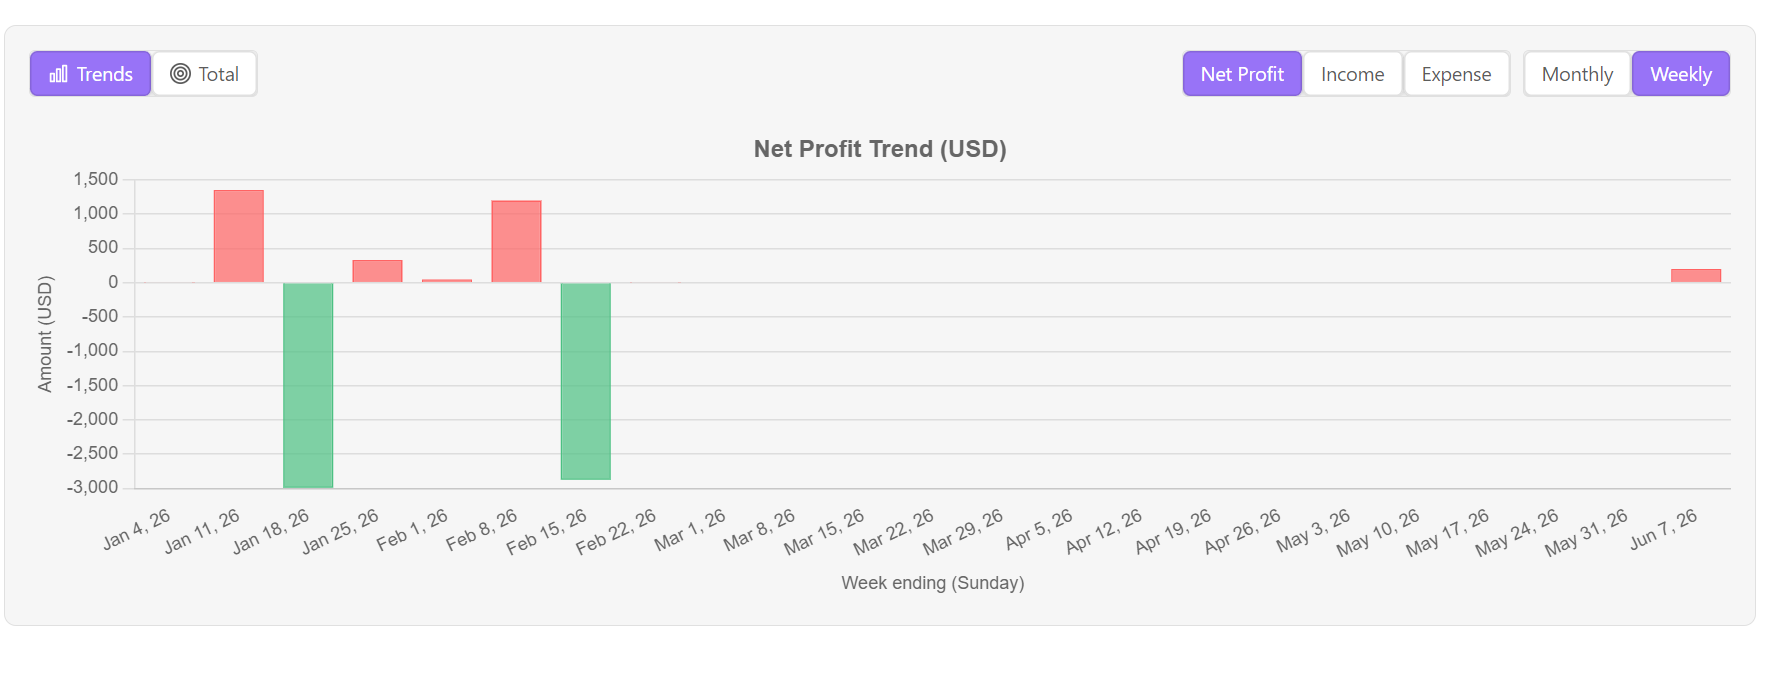
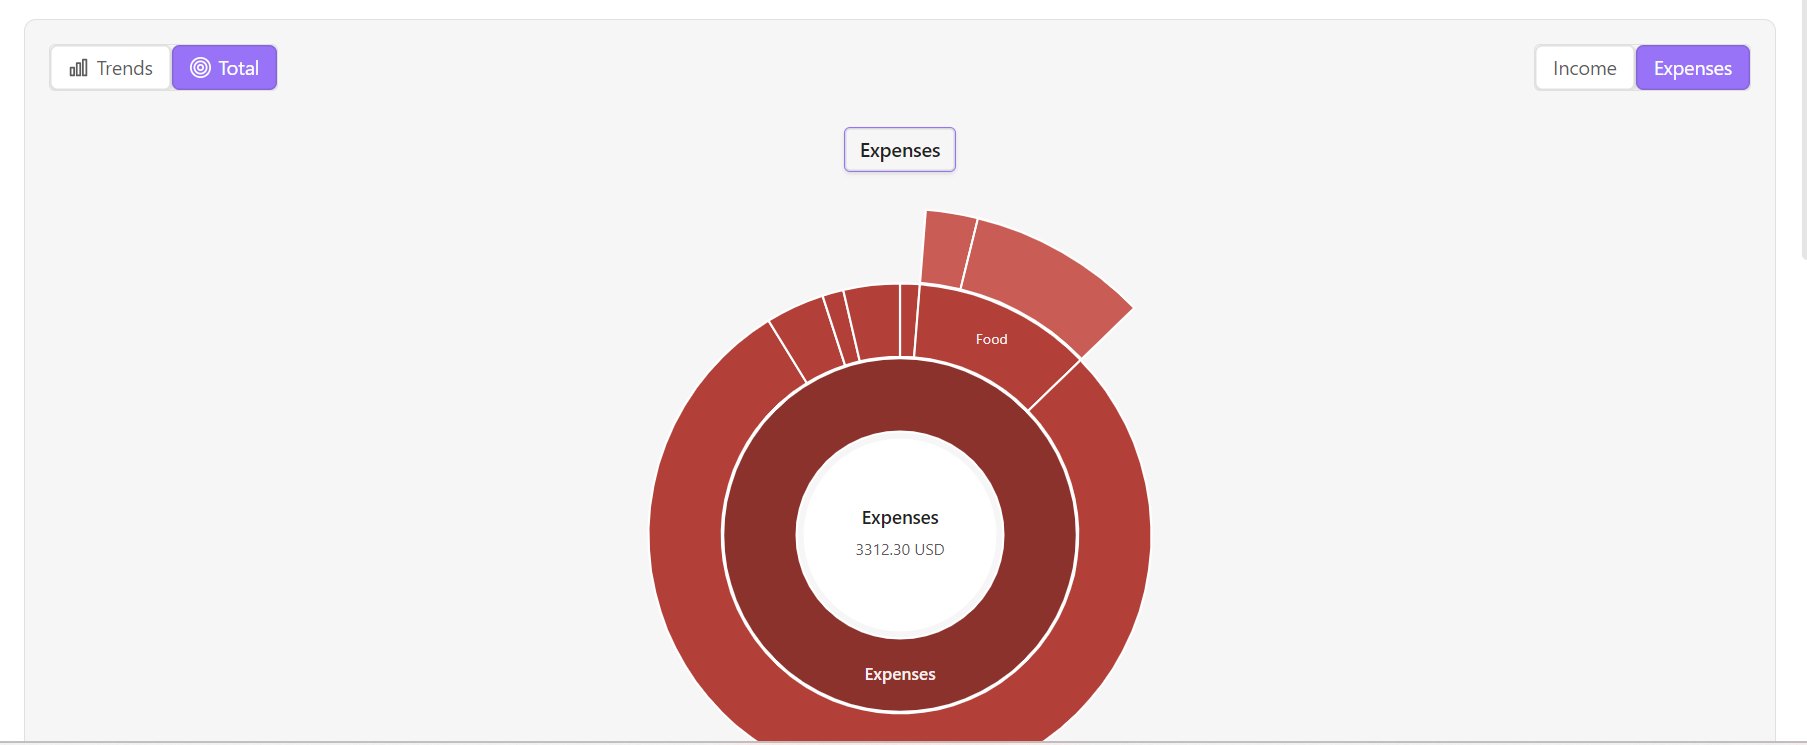
The statement is divided into two primary sections:
- Income: Revenue inflows (e.g.,
Income:Salary,Income:Dividends). In Beancount, inflows are represented as negative numbers internally. The dashboard flips the sign for display so that income appears as a positive value. - Expenses: Operational outflows (e.g.,
Expenses:Food,Expenses:Rent). Expenses are positive values.
Net Profit Calculation
At the bottom of the statement, the Net Profit (or Net Loss) is computed:
Net Profit = Total Income - Total Expenses
If your income exceeds your expenses, you have a net profit (displayed in green). If expenses exceed income, it is a net loss (displayed in red).
🏛 Valuation Methods
Like the Balance Sheet, you can view the Income Statement through three valuation lenses:
- Market Value: Converts all flows to your Operating Currency using the latest market prices.
- At Cost: Evaluates flows using the cost basis at the time of transaction.
- Units: Displays raw counts (e.g.
1200 USD,150 EUR) without conversion.